
Retail Analytics Platform
NATIONAL PHARMACY
Product Strategy / Product Design
After 8 years of marginal upkeep, our client found its analytics platform crufty and slow. They reached out to Fjord for help. Their ask was two-fold. For the near term, they wanted us to redesign the product interface to drive greater adoption and use. For the long term, they wanted us to create a product strategy to drive the platform's future development, ensuring its ongoing relevance.
I served as the UX deslgn lead with respect to product re-design — responsible for activities and outputs across discovery, definition and design. Engagement took shape across 14 weeks, with the first 4 weeks focused on discovery and definition. Design took shape across 5 sprints over 10 weeks.
I had the support of a project manager and a UI design lead who helped shape the design system governing the interface. We also had the help of an additional product designer who helped with production.
The Opportunity
In the face of competition from online retailers, traditional retailers have invested in analytics to drive better decision making with regard to determining with what to stock, and how to sell and promote products.
RESPONSIBILITIES
Discovery
• Primary Research
Definition
• Interaction Model Definition
• Design System Creation
Design
• Content Architecture
• Interface Design
• Software Prototype
• Primary Research
Definition
• Interaction Model Definition
• Design System Creation
Design
• Content Architecture
• Interface Design
• Software Prototype
ROLE
UX Design Lead
TEAM
Project Manager
UI Design Lead
Product Designer
UI Design Lead
Product Designer
Key Insights and Core Challenges
After meeting with analysts, and observing them in action, we found that analysts approached their work like detectives — canvasing to establish context and searching for patterns to formulate hunches. Ultimately, analysts struggled due to the platform's inflexiblity and cumbersome interface.
VAGUE LABELS
Analysts had a hard time finding the right data sources for their research needs. Reports were given vague labels that failed to explain what they contained.
CUMBERSOME SETUP
Report configuration was facilitated through one lengthy form — making it easy to get lost and difficult to correct for errors.
UNAIDED ORGANIZATION
By the comparative nature of projects, analysts often ran multiple reports to gather the necessary data. This meant that data output quickly became an untenable jumble that agents had to sift through.
Our Solution
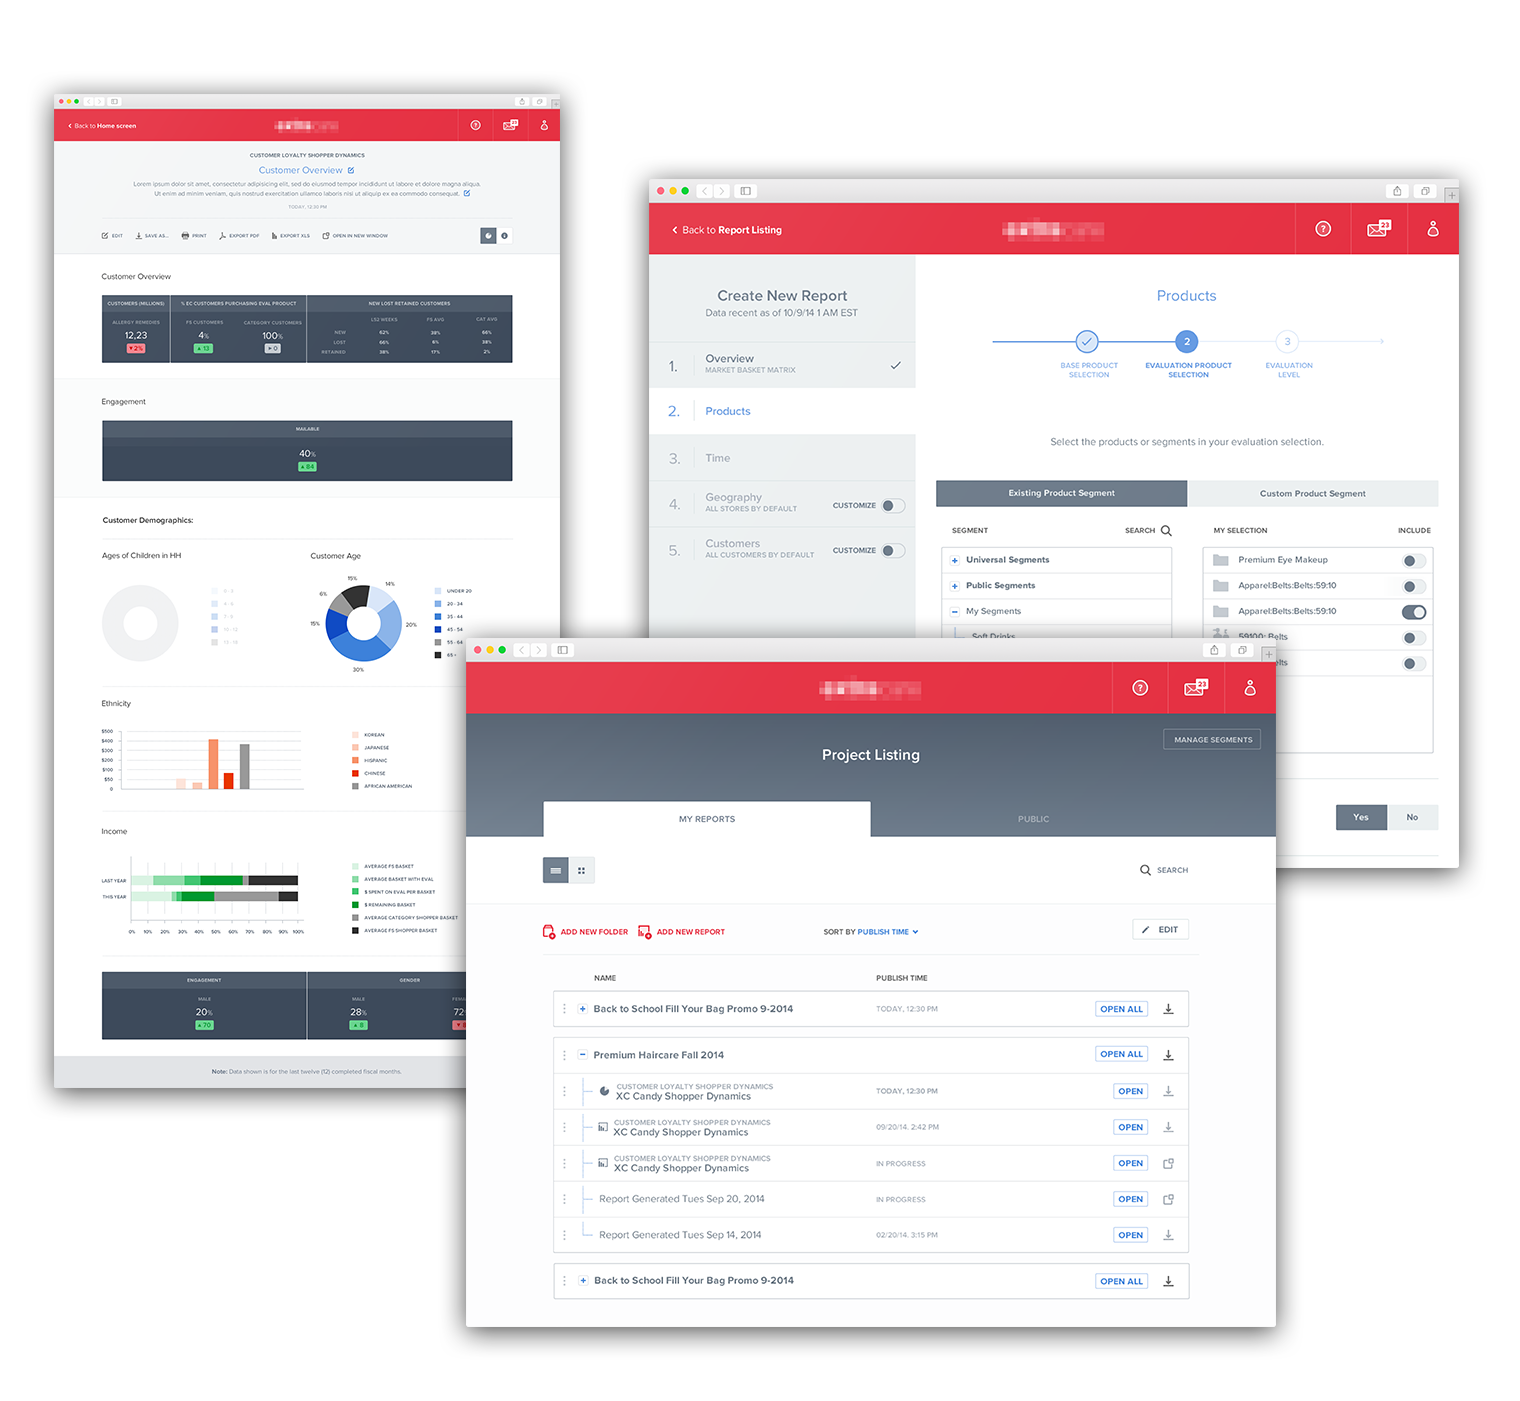
To meet the needs of analysts, we redesigned the analytics platform from the ground-up — replacing its antiquated job-based interaction model with a modern document-centered interaction model.
The interface was also contemporized with a post-flat material aesthetic and a generous use of white space for improved scanability.
The interface was also contemporized with a post-flat material aesthetic and a generous use of white space for improved scanability.
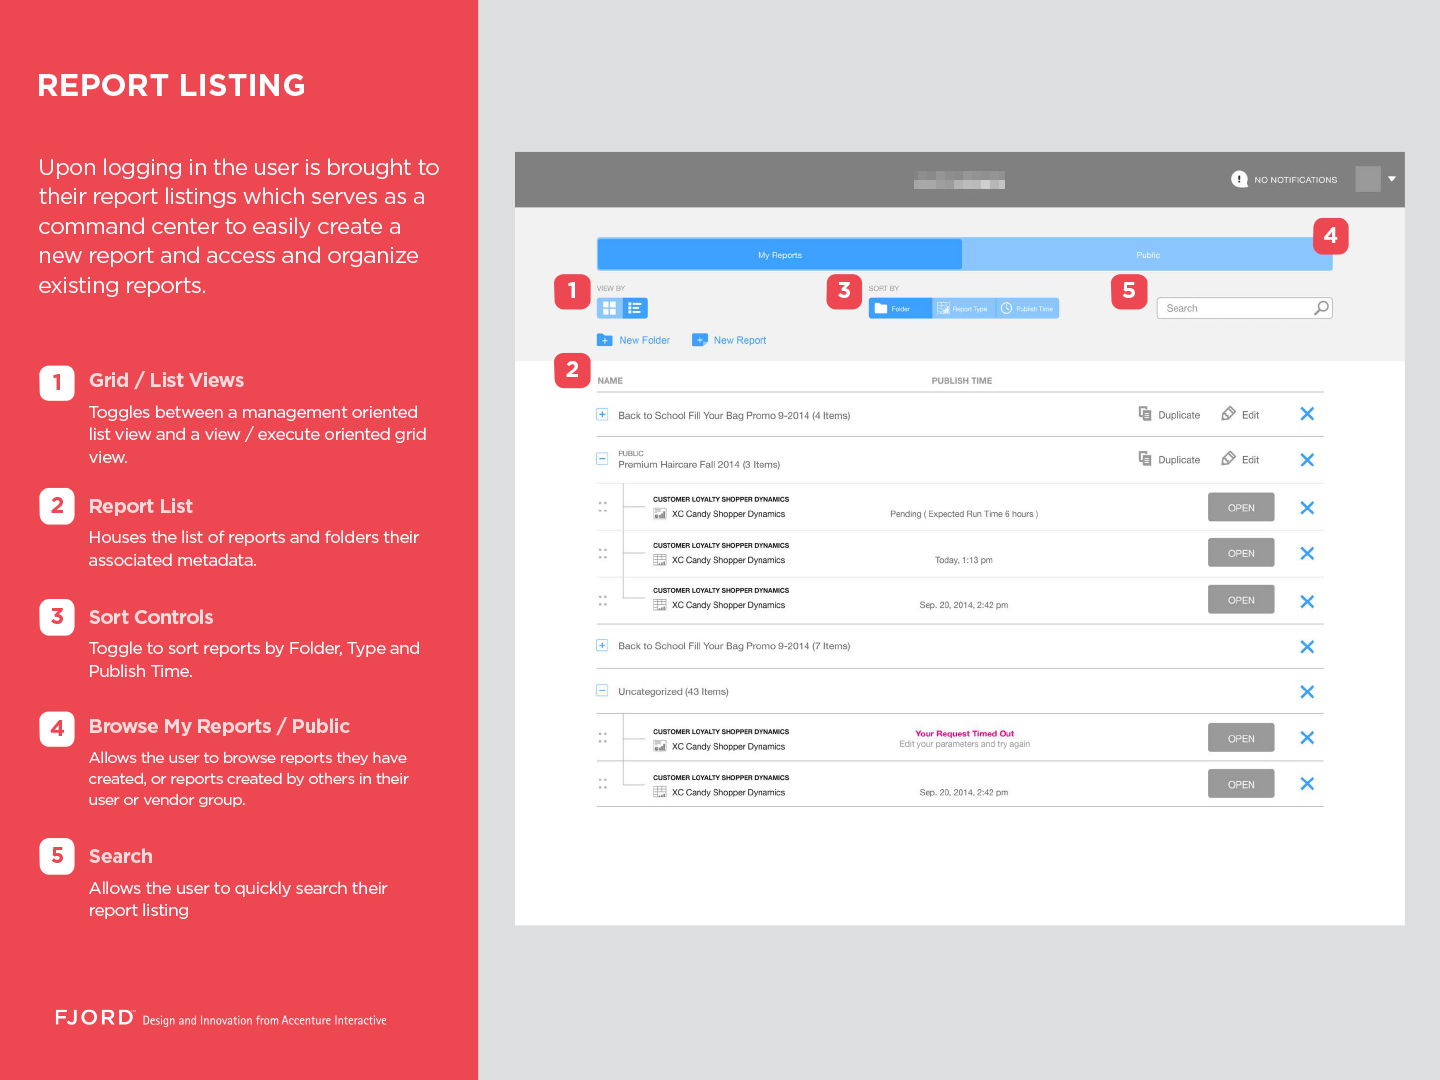
To aid in output organization, we introduced project folders to allow for quick and easy access to related reporting.
PROJECT FOLDERS
Wireframe with functional specification annotations.
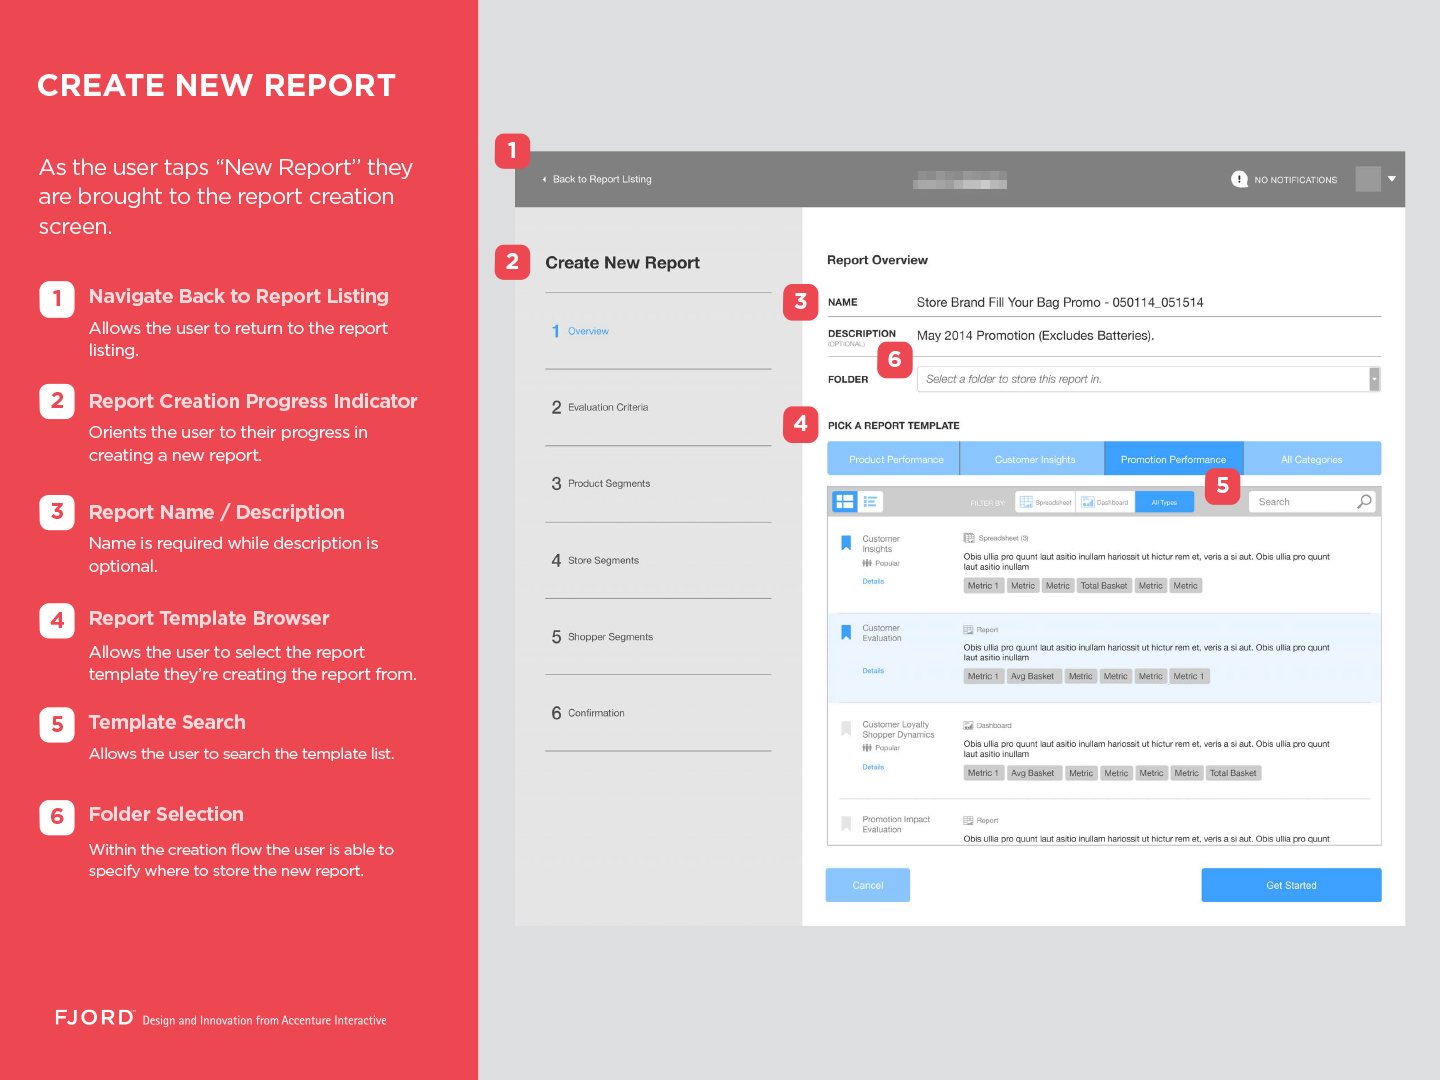
To assist analysts in identifying the right sources of data, we created a robust template browser that listed detailed descriptions, sample output, and included datatypes pertaining to each report.
TEMPLATE BROWSER
Wireframe with functional specification annotations.
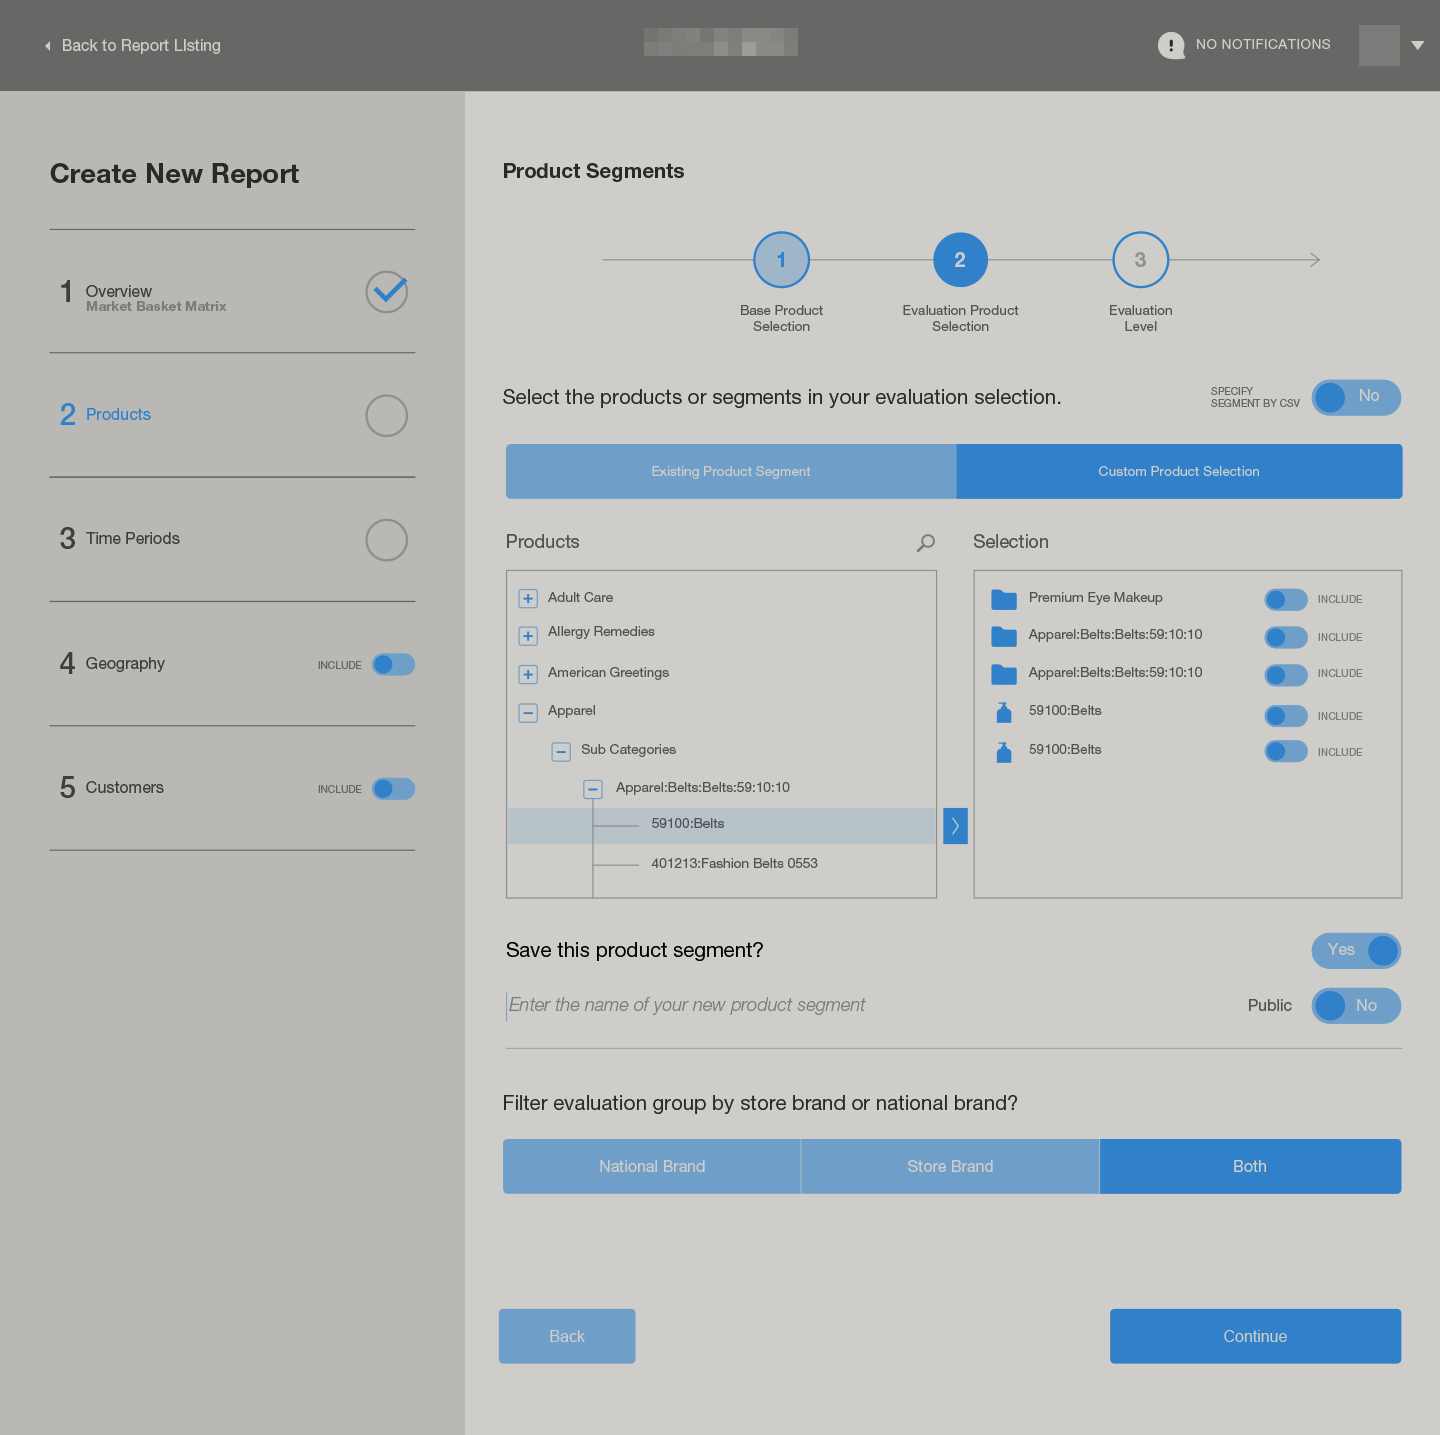
In place of the lengthy report configuration, we introduced a progressive configuration flow.
The new report configuration included progress indicators, inline form validation, as well as the ability to apply and create segmentation based on geography, product selections and customer behavior.
The new report configuration included progress indicators, inline form validation, as well as the ability to apply and create segmentation based on geography, product selections and customer behavior.
PROGRESSIVE REPORT CONFIGURATION
Wireframe
Behind the Scenes


Learn more about me.
